Please note: the ranges in this article are indicative and intended only to illustrate typical project sizes. They are not a quote or a price list. The cost of a specific project can only be estimated after reviewing your data and requirements.
Two cost components: licences and delivery
Power BI costs fall into two buckets that are often blurred together:
- Licences, paid to Microsoft on an ongoing monthly or annual basis.
- Implementation, the one-off effort of connecting data, building the model and reports, setting up security and training users — plus ongoing support and enhancements.
In smaller organisations implementation dominates the budget. In large enterprises with thousands of report consumers, licensing takes over.
Licensing at a glance
Microsoft licenses Power BI per user (Pro, Premium Per User) or through capacity as part of Microsoft Fabric. Prices and terms change, so always check the current price list. For a first estimate you need to know:
- how many people will create and publish content,
- how many will only consume reports,
- whether you need capacity features such as large models, more frequent refreshes or sharing with unlicensed users.
Many organisations on Microsoft 365 E5 already have Power BI Pro included. Check what you own before buying more.
What drives implementation cost
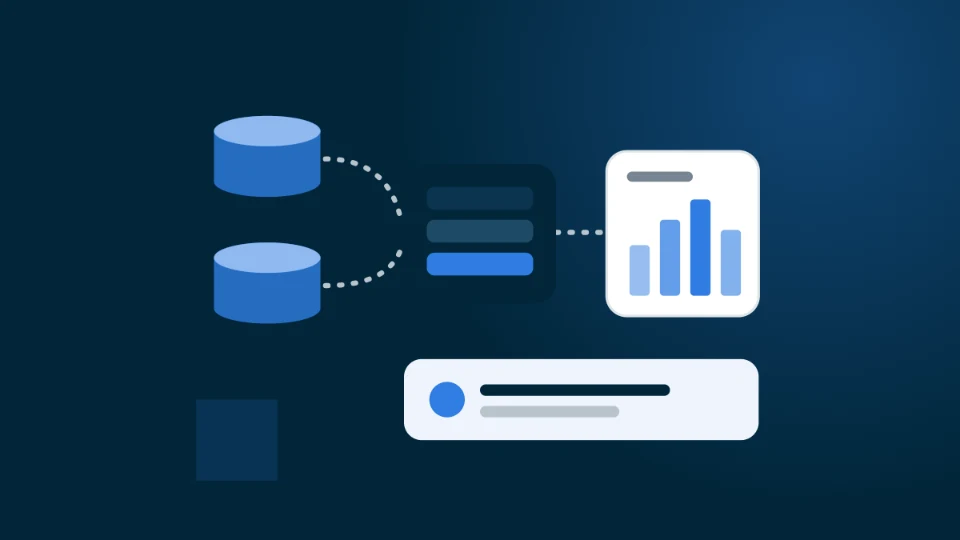
Data sources. Connecting a single database or a set of spreadsheets is straightforward. Combining ERP, CRM, e-commerce and manually maintained files means cleansing, matching and error handling — typically the largest line item.
Data quality. Duplicate customers, inconsistent product codes across systems or missing history extend projects more than report design ever does.
Data model. A solid star-schema model with clearly defined measures is an investment that pays back with every new report. Cutting corners here means paying later.
Number and complexity of reports. Five well-designed dashboards are cheaper and more useful than thirty reports nobody reads.
Security. Row-level security, permission hierarchies and auditing add effort, especially when access rules must be synchronised with an HR system.
Refresh automation. If data lives on on-premises servers, an on-premises data gateway has to be set up and maintained.
Training and adoption. Reports people cannot use are wasted money. Budget for training both creators and consumers.
Indicative project sizes
The table below shows typical effort in person-days. Individual projects can differ substantially.
| Project type | Typical scope | Indicative effort |
|---|---|---|
| Pilot | 1–2 data sources, 2–3 reports, basic model | a few to low tens of person-days |
| Department | multiple sources, shared model, security, training | tens of person-days |
| Enterprise | data warehouse, central model, governance | high tens to hundreds of person-days |
The final budget depends on your partner's rates and how much work your internal team can take on.
Keeping the budget under control
- Start with a pilot in one department, focused on one clear business problem. You validate data and value at low risk.
- Agree metric definitions up front. What exactly counts as "revenue" or "margin"? Definition disputes are the most expensive part of BI projects.
- Fix data quality at the source, not with workarounds in reports.
- Build on a shared semantic model so each new report costs less than the last.
- Plan for operations. Who will maintain the reports once the project ends?
Bottom line
The cost of a Power BI implementation is driven mainly by data, not by the number of charts. Licences are predictable; implementation effort depends on the number and quality of sources, the data model and security requirements. A focused pilot and well-defined metrics are the best protection against budget overruns.
Want an estimate for your situation? See how our Power BI implementation works — after a short assessment you get a budget and a pilot plan.