What is a data warehouse
A data warehouse is a central store that is regularly loaded with data from your business systems — ERP, CRM, e-commerce, production, accounting and external sources. In the warehouse, data is cleansed, harmonised and stored in a structure designed for analysis. Business intelligence sits on top: reports, dashboards, planning and advanced analytics.
A modern data warehouse and business intelligence solution has several layers:
- Data ingestion (ETL / ELT) — automated, scheduled loading from source systems, including change history,
- Storage — a data warehouse in Azure SQL, a lakehouse or warehouse in Microsoft Fabric, or a combination with a data lake,
- Data model — facts and dimensions (revenue, customer, product, time, cost centre) with consistent definitions,
- Semantic layer and reporting — models and reports in Power BI that users consume,
- Data management and quality — completeness checks, load monitoring, a data catalogue and access control.
A data warehouse separates analytics from operational systems. Reports no longer put load on your ERP, data from different systems fits together, and history is preserved even when a source system changes or is replaced.
Who it is for
A data warehouse implementation pays off for organisations that:
- need to combine data from multiple systems and currently match it by hand in spreadsheets,
- want to track history and trends — for example margin development over years, even after price lists or the organisation have changed,
- run reports that slow down the ERP or take hours to complete,
- need consistent KPI definitions across departments, branches or subsidiaries,
- are planning an ERP replacement and want to keep historical data available for reporting.
Smaller companies with one core system often start with Power BI alone. We add a data warehouse once the number of sources, data volumes or history requirements outgrow direct reporting.
A typical project and timeline
- Assessment (2–3 weeks). Key business questions, KPIs and their definitions, source systems, data quality and an architecture proposal.
- First data domain (typically 6–10 weeks). Ingestion from the main sources, a data model for one domain (for example sales or finance), a semantic model and reports.
- User validation (1–2 weeks). Reconciling the numbers with existing reports and the general ledger — without trust in the numbers, a data warehouse has no value.
- Scale-out. Further domains (procurement, inventory, production, HR), more sources and advanced analytics.
- Operations. Load monitoring, failure alerts, access management and continuous improvement.
The first domain with reconciled numbers is typically live within two to three months. Each subsequent domain reuses existing dimensions, so it comes together faster.
Integration with Microsoft products
- Power BI — reporting and semantic models on top of the warehouse, shared in Teams and on mobile.
- Microsoft Fabric and Azure — Data Factory, Azure SQL, Data Lake Storage, lakehouse and warehouse as the technical foundation.
- Dynamics 365 and Dataverse — direct access to CRM and ERP data and to Power Platform applications.
- Microsoft Purview — data catalogue, classification of sensitive data and lineage.
- Excel — analysis on the semantic model straight from Excel for users who prefer it.
From non-Microsoft systems we load data from common databases, SAP, regional ERP systems, e-commerce platforms, REST APIs and files. Where data must flow continuously, we combine the warehouse with system integration services.
How we work together
- Turnkey implementation — from assessment to operations, domain by domain.
- Data warehouse modernisation — moving from on-premises SQL Server to Azure or Microsoft Fabric without interrupting reporting.
- Data platform health check — reviewing architecture, performance, data quality and cost, with concrete recommendations.
- Advisory for data teams — architecture, dimensional modelling and best practices.
- Operational support — monitoring data loads and evolving the solution as requirements change.
Use cases
Common pitfalls we help you avoid
- Technology before questions. We build the warehouse around the questions it must answer, not around whatever data happens to be available.
- Unreconciled numbers. If figures do not match the books, users go back to their spreadsheets. Reconciliation is a fixed part of every project.
- No data owners. Every domain needs someone accountable for definitions and quality.
- A monolith without priorities. We deliver domain by domain so the first value arrives in weeks, not after a year.
Benefits
Choosing a BI tool? Download our guide to choosing a BI tool.
Frequently asked questions
What is the difference between a data warehouse, data lake and lakehouse?
A data warehouse holds structured, cleansed data for reporting; a data lake stores raw data in any format; a lakehouse combines both.
ETL or ELT?
On modern cloud platforms usually ELT — data is loaded first and transformed in the target platform.
How long until the first deliverable?
The first data domain with reports is typically ready in 6–12 weeks.
Related articles
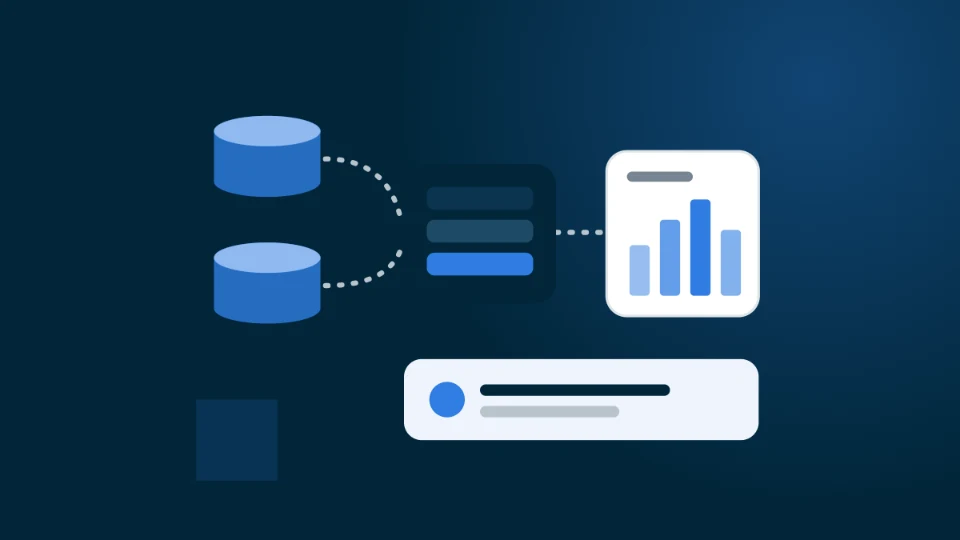
Data warehouse vs. data lake vs. lakehouse: what's the difference?
Three terms that are constantly mixed up in data projects. We explain the differences in plain language and help you decide which architecture fits business reporting in a mid-sized organisation.
· 4 min read
Related case studies
Illustrative example
Unified sales reporting in Power BI
Distribution company, 350 employees
Power BI · Azure SQL · Dataflows · Excel
Interested in Data warehousing and business intelligence?
Tell us briefly what you are working on. We usually reply within one business day to arrange a free consultation.
Fields marked * are required.
Related services
Microsoft Fabric — a modern data platform
Bring your data, data warehouse and reporting together on one platform with Microsoft Fabric.
Power BI implementation and reporting
Clear Power BI reports and dashboards your leadership trusts — built on a solid data model.